> For the complete documentation index, see [llms.txt](https://docs.screendesk.io/llms.txt). Markdown versions of documentation pages are available by appending `.md` to page URLs; this page is available as [Markdown](https://docs.screendesk.io/request-screen-recording/developer-tools/console-logs.md).
# Console logs
Console logs capture what your app wrote to the browser console during the session. This is the fastest way to debug client-side failures without asking customers to open DevTools.
### Availability
Console logs are captured for widget-based recordings when enabled by an admin.
You typically need:
* The Screendesk widget installed on your site
* Console logging enabled in workspace settings
{% hint style="info" %}
Console logs start capturing after you enable the feature. Older recordings won’t be backfilled.
{% endhint %}
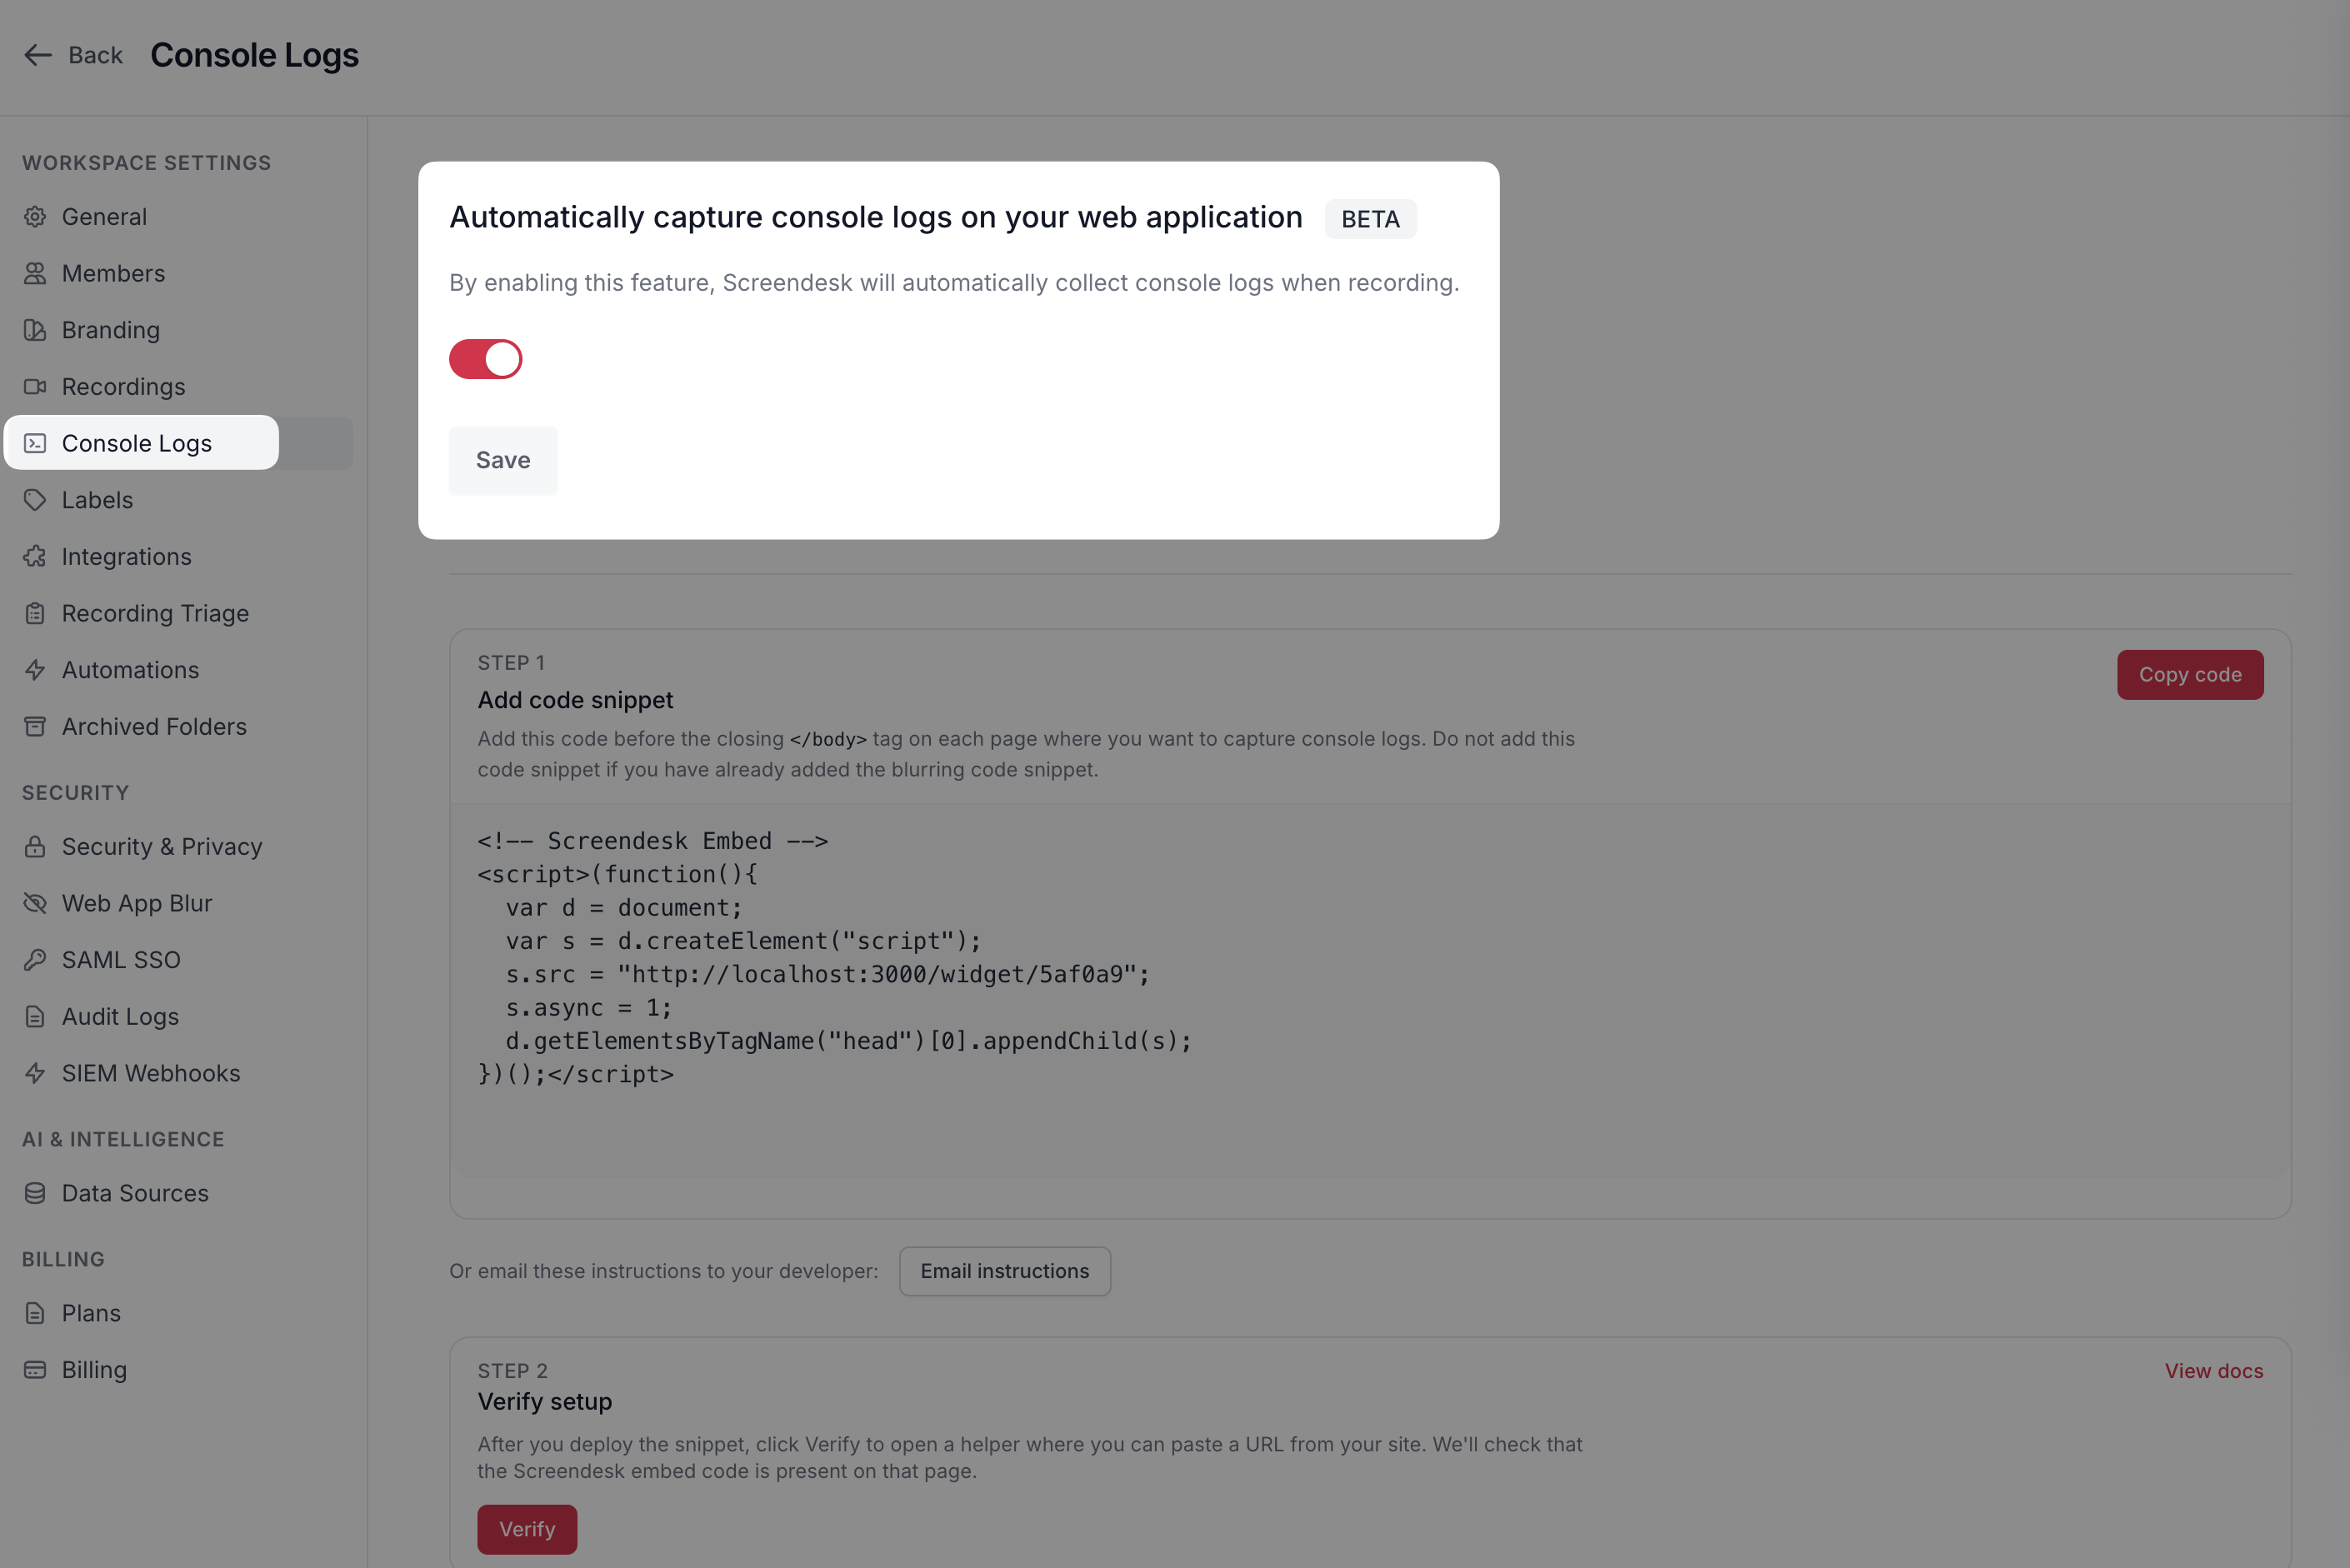
### Enable console logs (admin)
{% stepper %}
{% step %}
**Install the widget (if needed)**
Console capture relies on the Screendesk script on your site.
See [Installing Screendesk script](https://docs.screendesk.io/~/revisions/pAg2d5GCwbZlpJ20UTRh/request-screen-recording/developer-tools/installing-screendesk-script).
{% endstep %}
{% step %}
**Turn on console capture**
Go to **Settings → Console Logs**.
Enable **Enable Console Logs**.
{% endstep %}
{% step %}
**Verify on a test recording**
Create a new test recording. Then confirm you see a **Console** tab on the recording.
{% endstep %}
{% endstepper %}
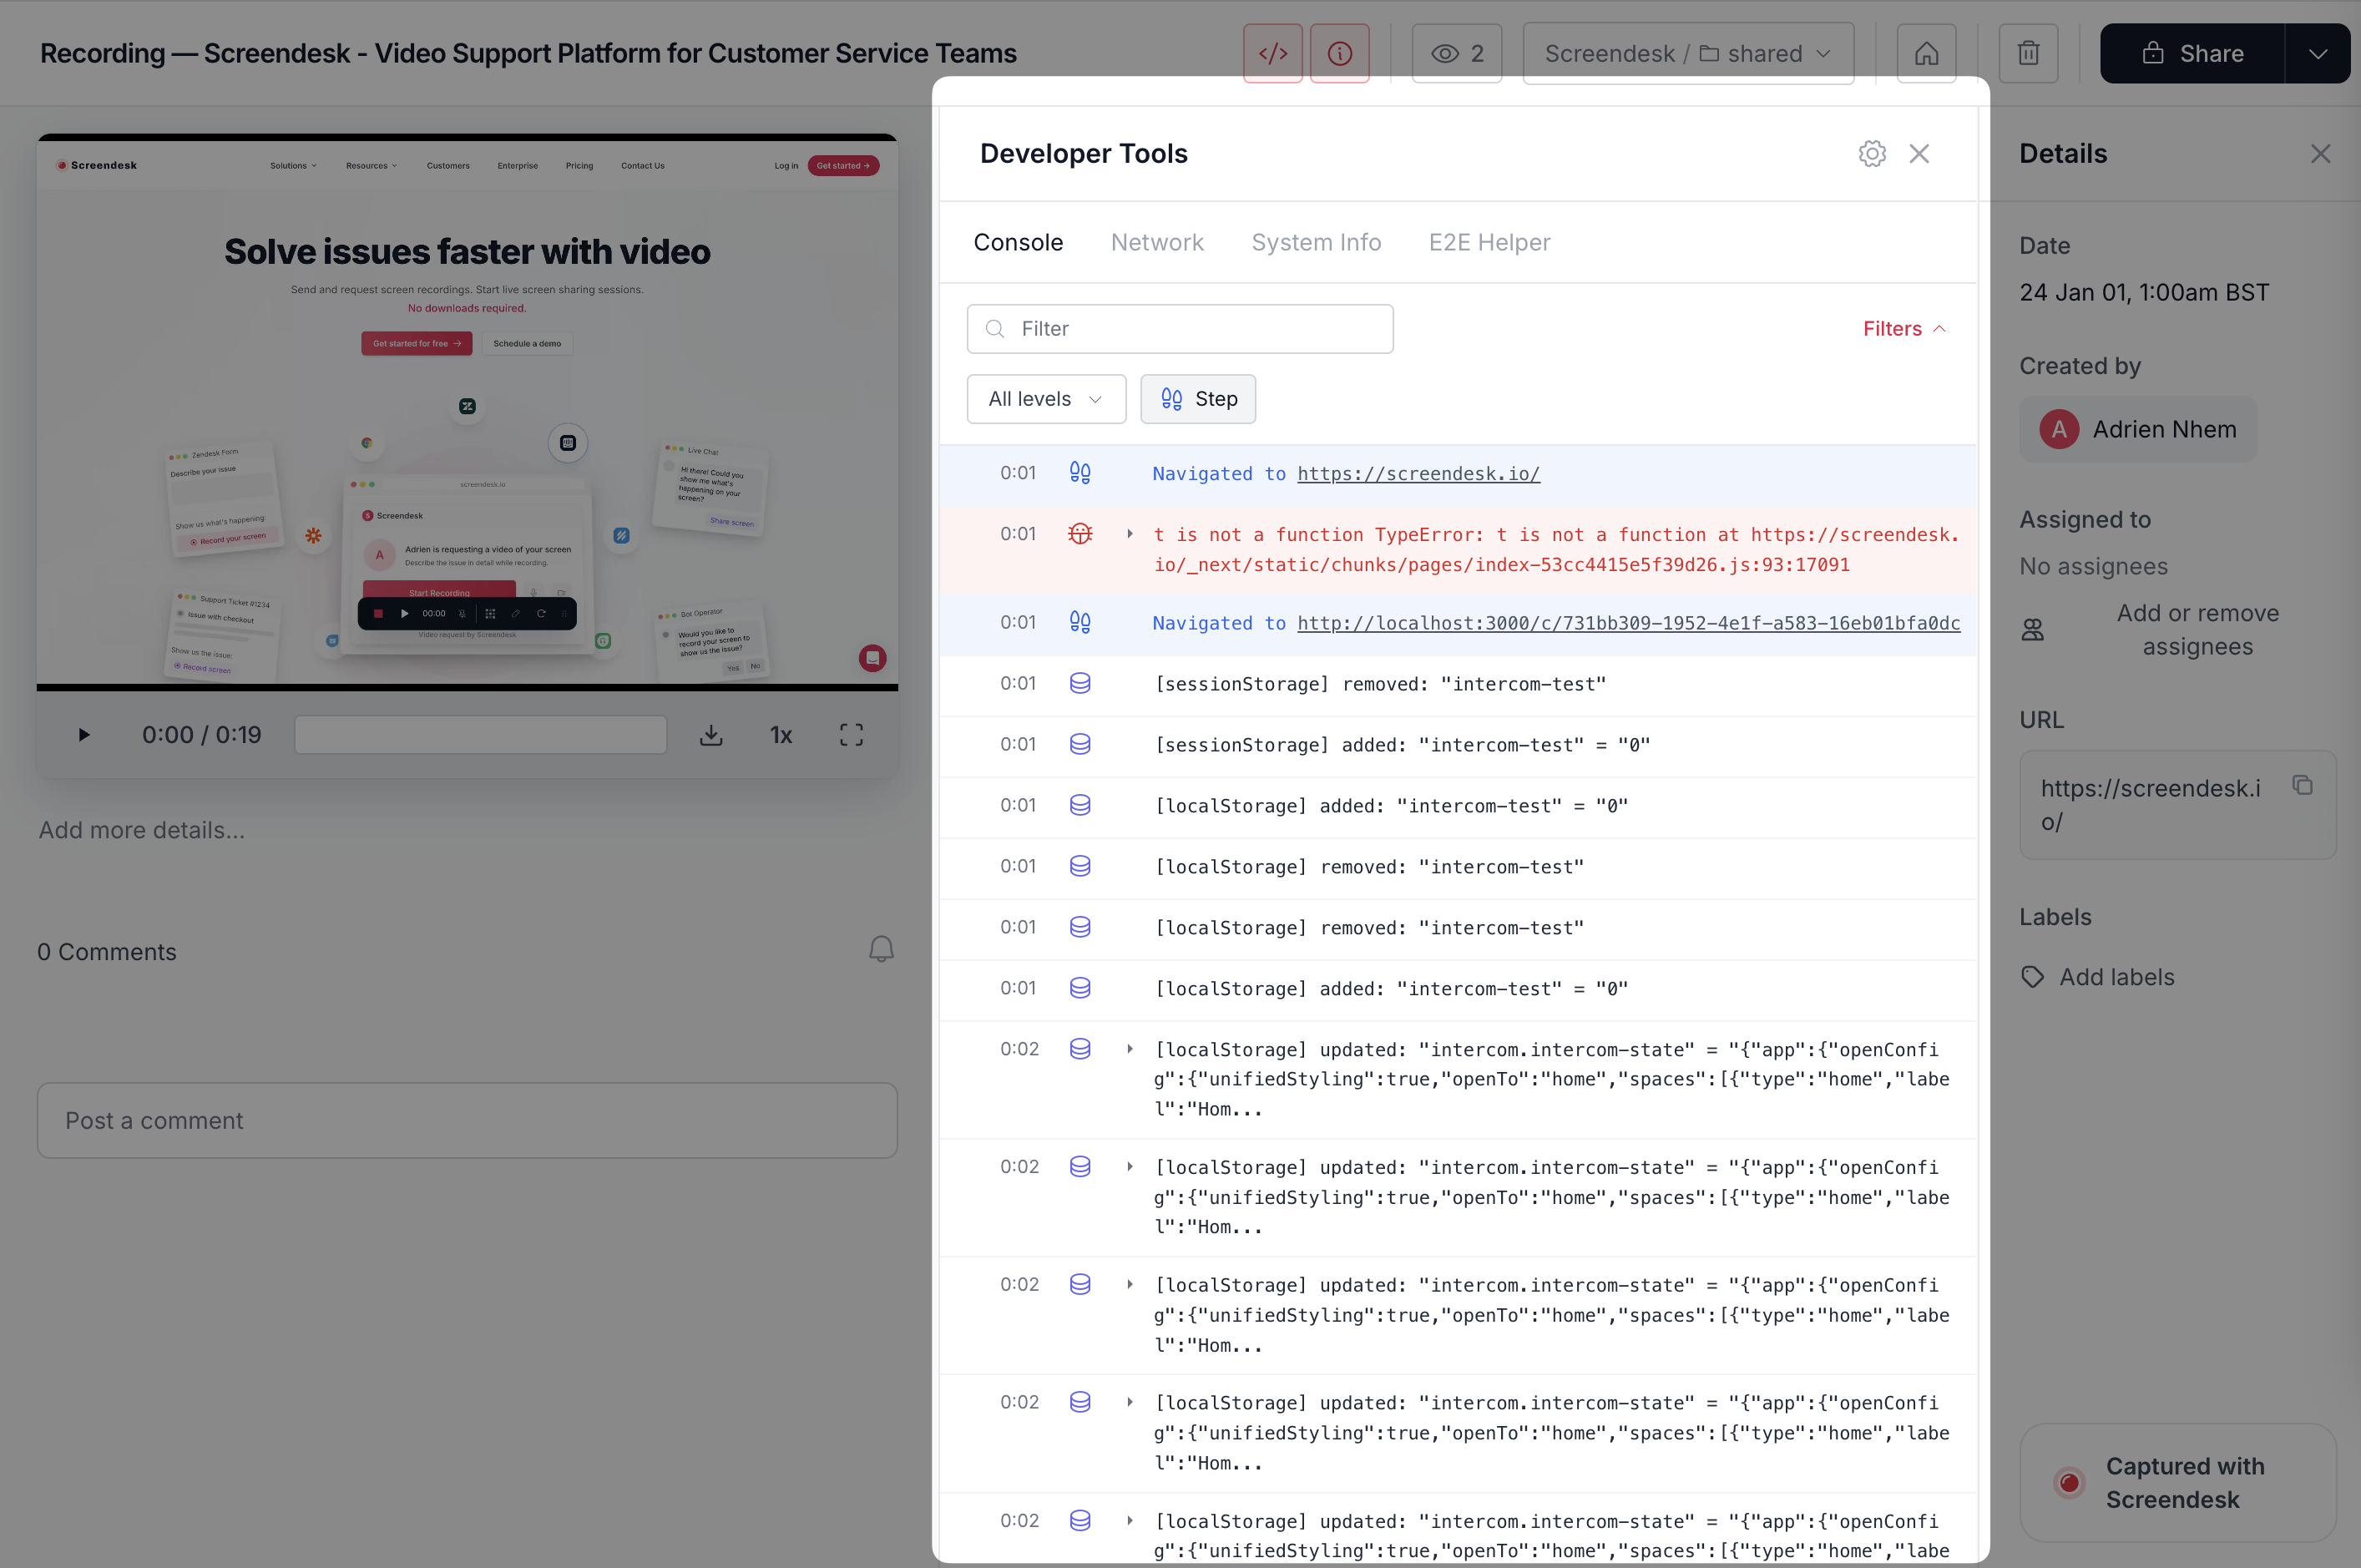
### Where to find console logs
1. Open a recording.
2. Click the **Console** tab.
3. Use search and level filters to narrow down noise.
### How to use console logs (fast workflow)
{% stepper %}
{% step %}
**Find the first real error**
Start with **Error** entries. Ignore repeated follow-on errors at first.
{% endstep %}
{% step %}
**Correlate with the video**
Jump to the timestamp. Watch what the user did right before the error.
{% endstep %}
{% step %}
**Escalate with the right payload**
Include:
* Error message
* Stack trace
* Timestamp
* Recording link
{% endstep %}
{% endstepper %}
Common patterns (with examples)
**Uncaught TypeError**
```
TypeError: Cannot read properties of undefined (reading 'user')
```
Usually a frontend bug or missing data. Escalate with the stack trace.
**CORS blocked**
```
Blocked by CORS policy
```
Usually a server header or environment mismatch. Pair this with the failing request in network logs.
**Failed resource / 404**
```
Failed to load resource: the server responded with a status of 404
```
Usually a bad URL, missing asset, or wrong environment.
**Deprecation warnings**
These are rarely the direct cause. Track as tech debt unless they block the flow.
### Console logs vs. network logs
Use console logs when:
* UI breaks and you suspect frontend code
* You need stack traces and error context
Use network logs when:
* Data doesn’t load
* You need status codes, payloads, and responses
See [Network Logs](https://docs.screendesk.io/~/revisions/pAg2d5GCwbZlpJ20UTRh/request-screen-recording/developer-tools/network-logs).
### Privacy and security
{% hint style="warning" %}
Console logs can include sensitive data (tokens, IDs, and internal state). Limit access.
{% endhint %}
Recommended practices:
* Restrict access to technical roles.
* Redact secrets before sharing outside your org.
* Avoid copying full logs into public tickets.
### Troubleshooting
I don’t see a Console tab
Check these in order:
1. Console logging is enabled in **Settings → Console Logs**.
2. The Screendesk widget is installed on the page being recorded.
3. You’re testing with a new recording (no backfill).
4. Browser extensions aren’t blocking the widget.
Console logs are empty
This can be normal. Some apps don’t log anything unless there’s an error.
Try reproducing again, or add targeted logging in your app for the failing flow.
There are too many logs
Filter to **Error** first. Then search for the API endpoint or feature keyword.
If this is persistent, reduce verbose debug logs in production builds.
### Related pages
* [Network Logs](https://docs.screendesk.io/~/revisions/pAg2d5GCwbZlpJ20UTRh/request-screen-recording/developer-tools/network-logs)
* [System Info](https://docs.screendesk.io/~/revisions/pAg2d5GCwbZlpJ20UTRh/request-screen-recording/developer-tools/system-info)
* [Installing Screendesk script](https://docs.screendesk.io/~/revisions/pAg2d5GCwbZlpJ20UTRh/request-screen-recording/developer-tools/installing-screendesk-script)
---
# Agent Instructions
This documentation is published with GitBook. GitBook is the documentation platform designed so that both humans and AI agents can read, navigate, and reason over technical content effectively. Learn more at gitbook.com.
## Querying This Documentation
If you need additional information that is not directly available in this page, you can query the documentation dynamically by asking a question.
Perform an HTTP GET request on the current page URL with the `ask` query parameter, and the optional `goal` query parameter:
```
GET https://docs.screendesk.io/request-screen-recording/developer-tools/console-logs.md?ask=&goal=
```
`ask` is the immediate question: it should be specific, self-contained, and written in natural language.
`goal` is optional and describes the broader end goal you are ultimately trying to accomplish on behalf of the user. GitBook uses it to tailor the answer towards what is most useful for that goal.
The response will contain a direct answer to the question and relevant excerpts and sources from the documentation.
Use this mechanism when the answer is not explicitly present in the current page, you need clarification or additional context, or you want to retrieve related documentation sections.