> For the complete documentation index, see [llms.txt](https://docs.screendesk.io/llms.txt). Markdown versions of documentation pages are available by appending `.md` to page URLs; this page is available as [Markdown](https://docs.screendesk.io/request-screen-recording/developer-tools/network-logs.md).
# Network Logs
Network logs show what your app sent and received during a session. Use them to debug API failures, auth issues, and slow pages.
### Availability
Network logs are only available for certain capture types:
* ✅ Chrome extension recordings
* ✅ Replay-style captures (for example, Instant Replay)
* ✅ Standard customer-submitted recordings
{% hint style="info" %}
If you don’t see a **Network** tab, the recording type likely doesn’t support network capture.
{% endhint %}
### What gets captured
You can expect to see:
* Fetch/XHR requests
* Page navigations and redirects
* Static assets (JS, CSS, images, fonts)
* Third-party requests (analytics, CDNs)
* WebSocket connections (when present)
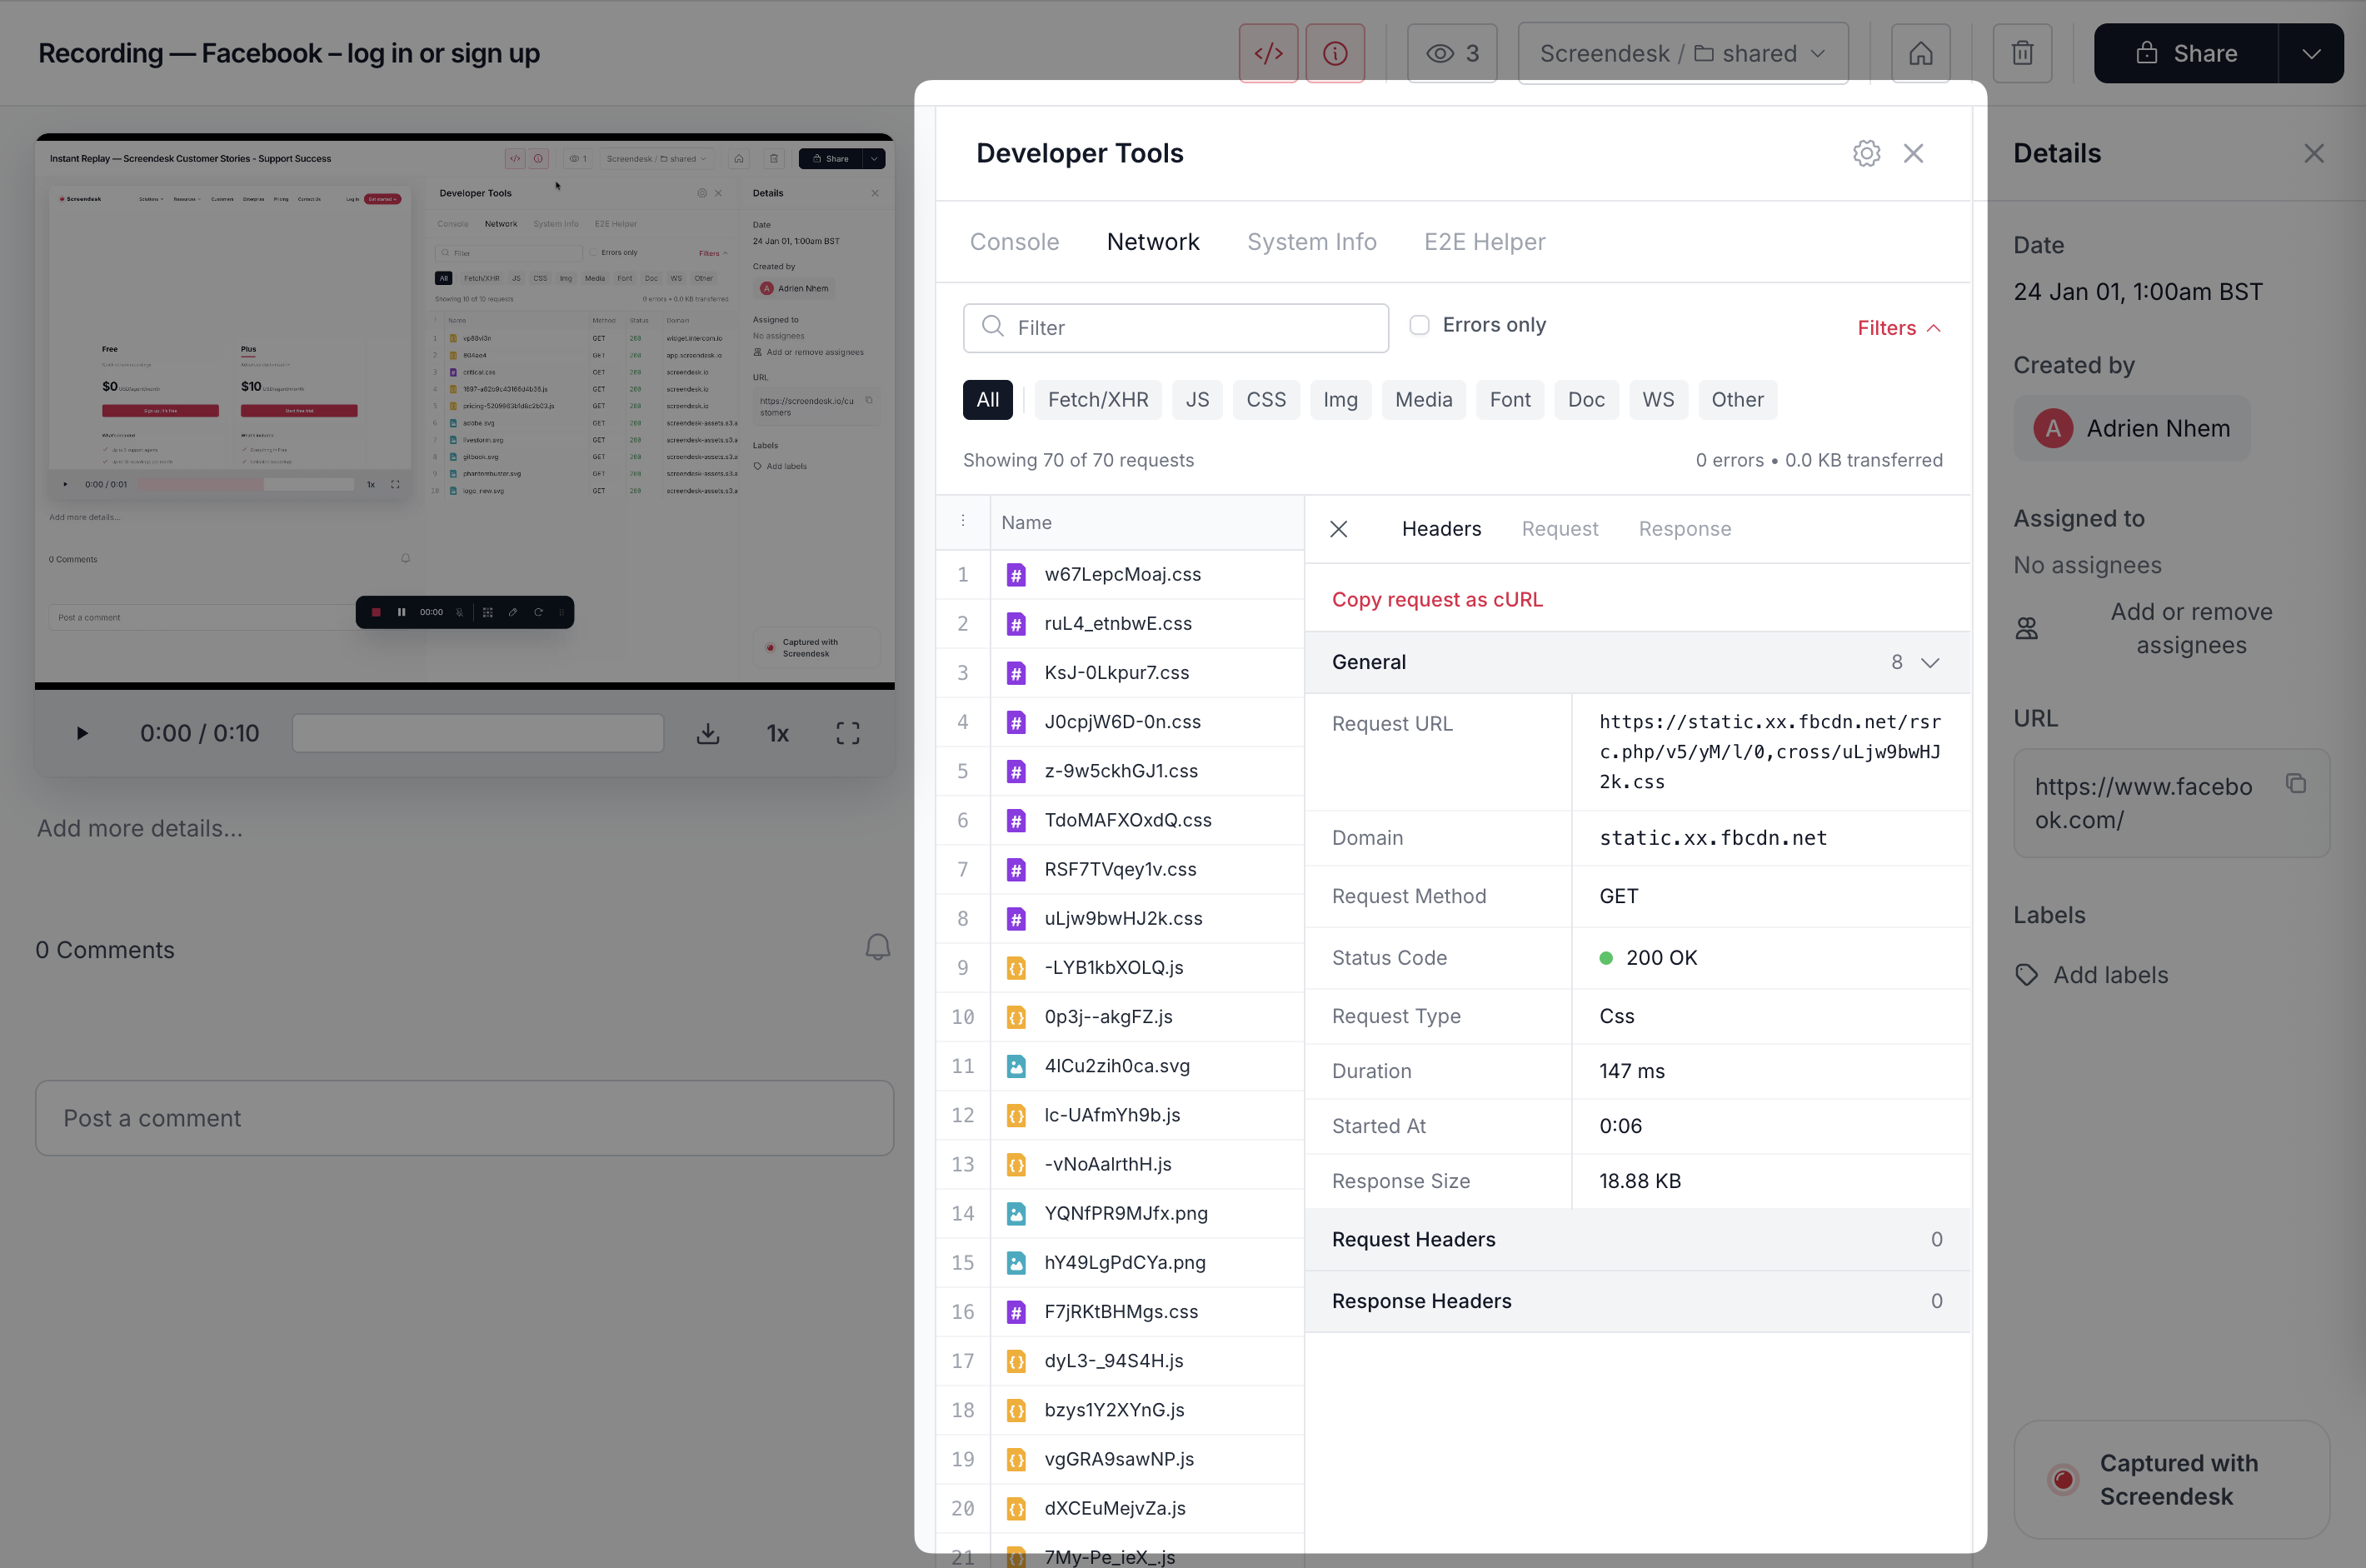
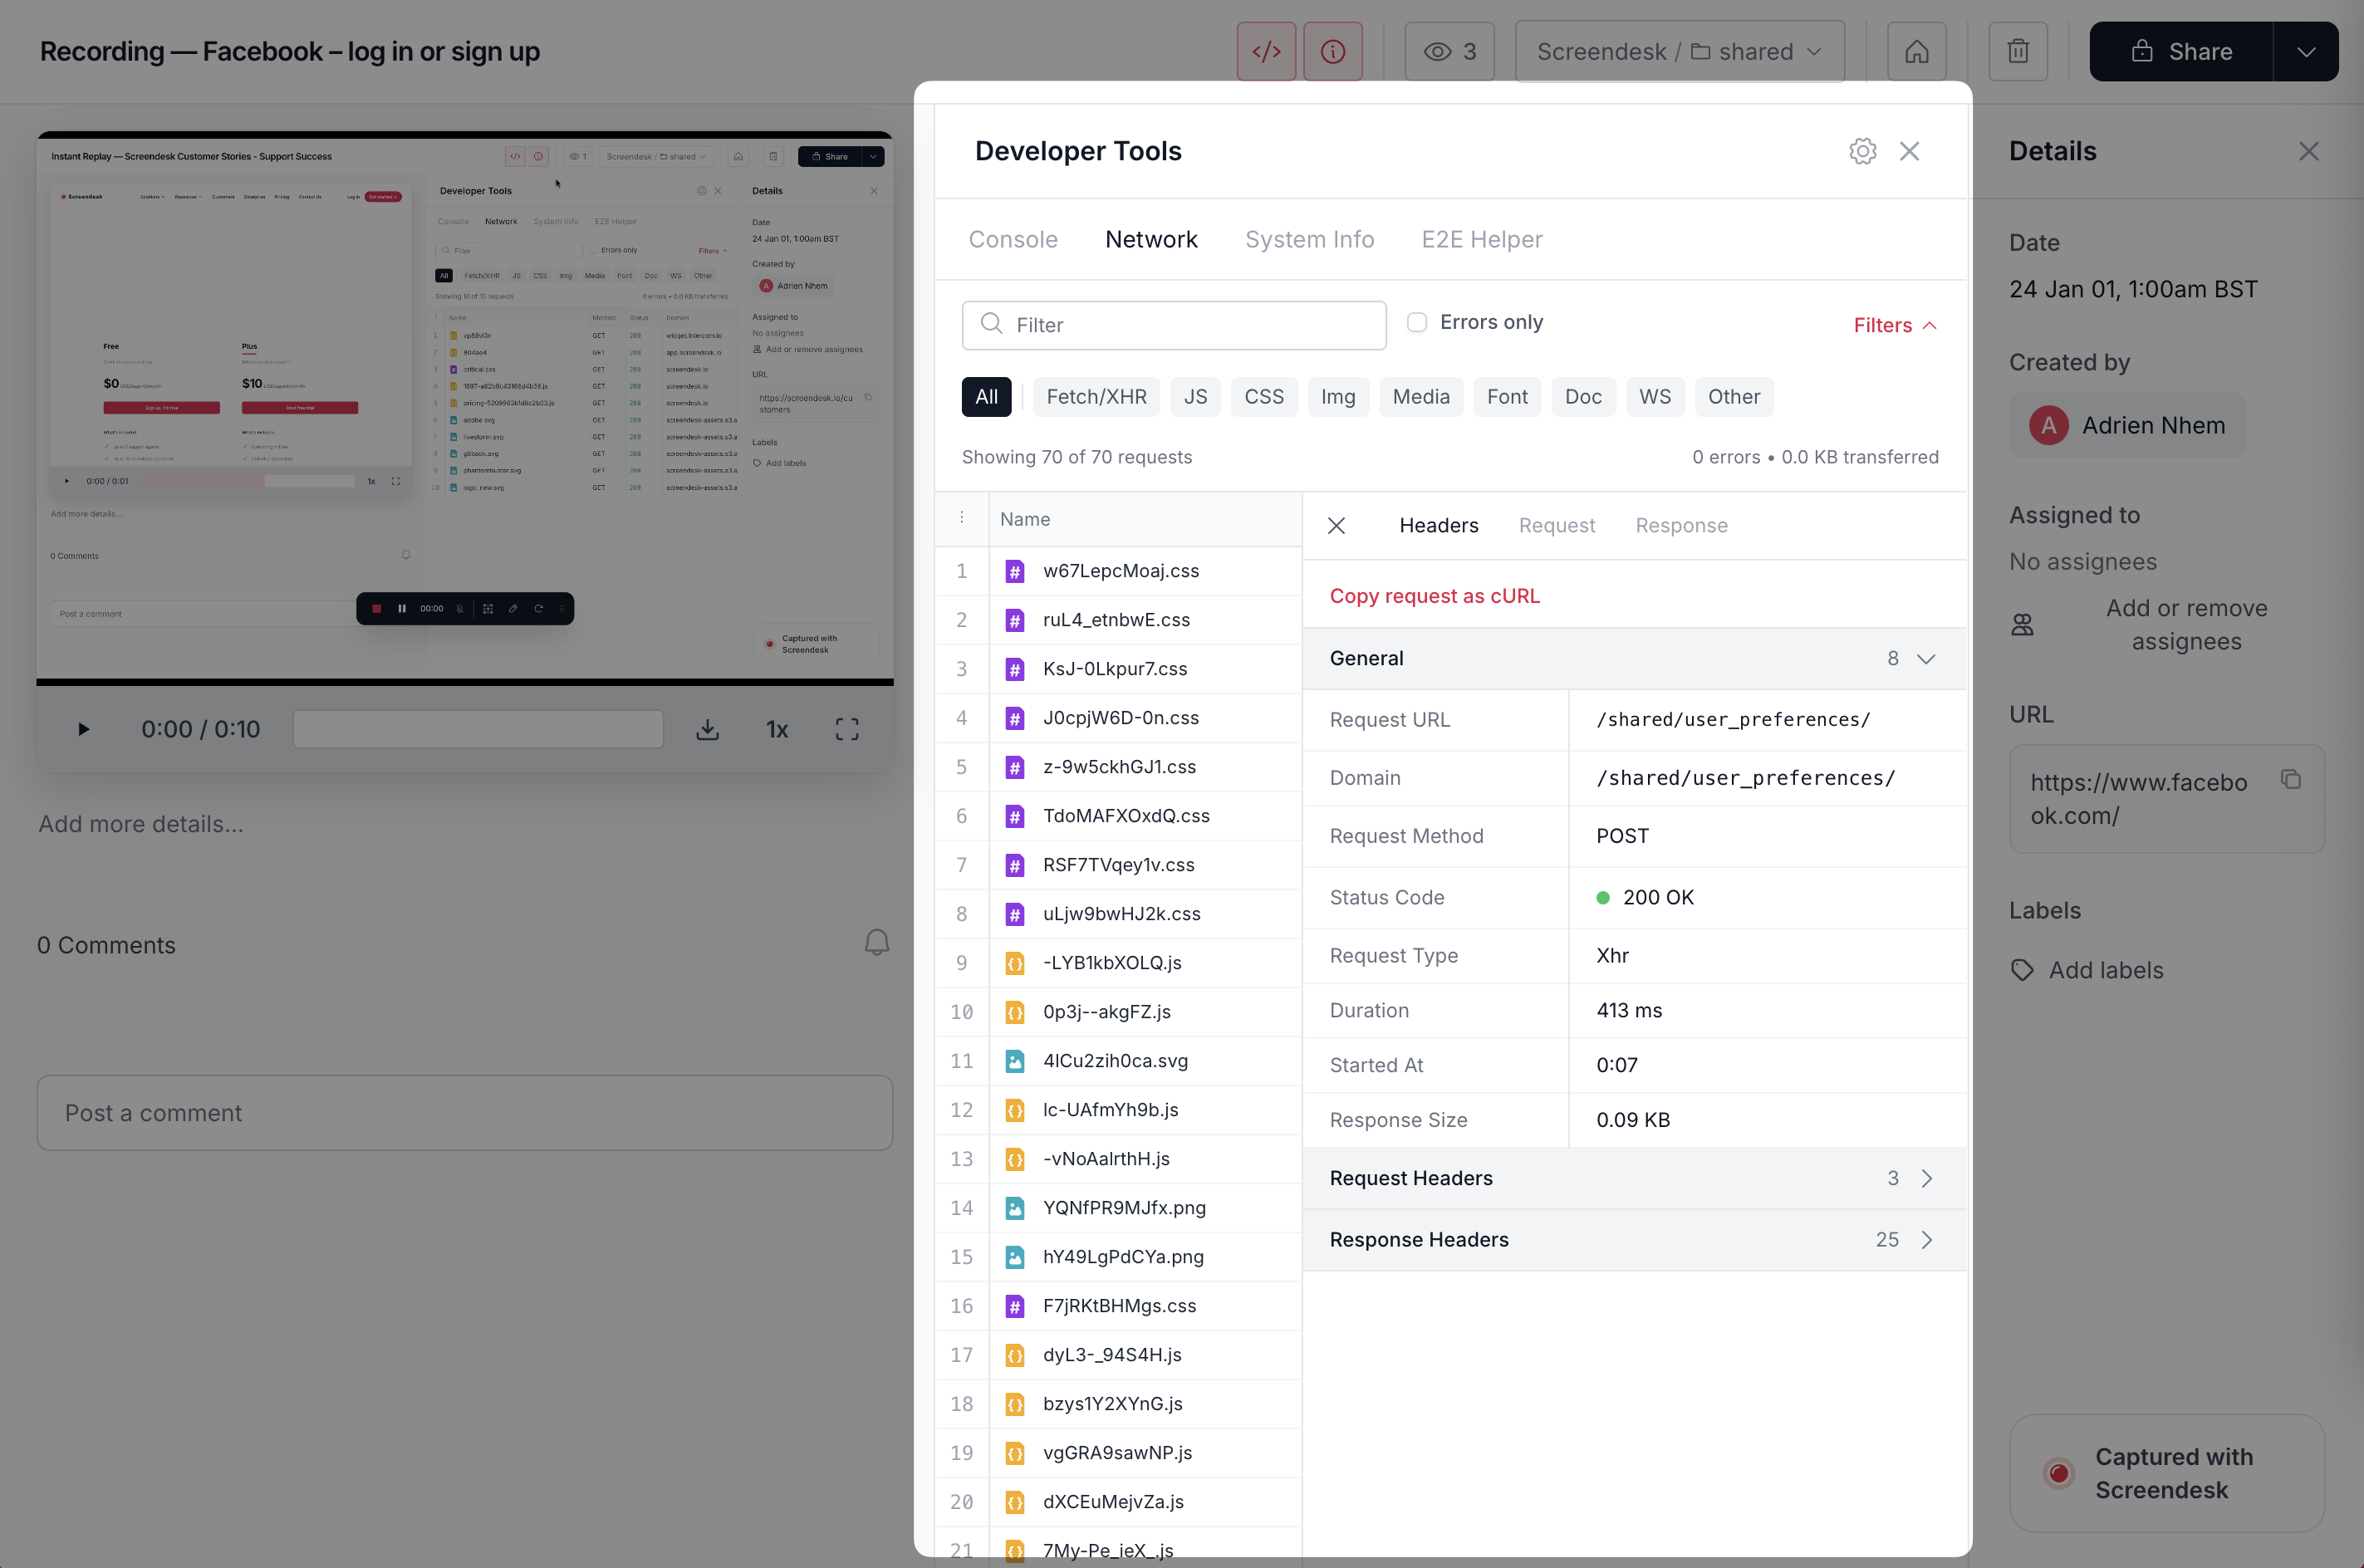
Per request, you typically get URL, method, status, timing, and a waterfall. You may also see headers, payload, and response data.
### Where to find it
{% stepper %}
{% step %}
**Open the recording**
Open the recording or capture in Screendesk.
{% endstep %}
{% step %}
**Open the Network tab**
Click **Network** in the developer tools panel.
{% endstep %}
{% step %}
**Filter to what matters**
Start with **XHR/Fetch**. Then enable **Errors only** if needed.
{% endstep %}
{% endstepper %}
### How to use network logs (fast workflow)
{% stepper %}
{% step %}
**Find the failing request**
Look for `4xx`, `5xx`, or `Failed`.
{% endstep %}
{% step %}
**Inspect details**
Check **Headers**, then **Payload**, then **Response**.
{% endstep %}
{% step %}
**Copy and reproduce**
Use **Copy as cURL** to reproduce outside the browser.
```bash
curl 'https://api.example.com/users/12345' \
-H 'Authorization: Bearer [REDACTED]' \
-H 'Content-Type: application/json'
```
{% endstep %}
{% endstepper %}
Common status codes and what to do
**`0` / Failed**
Usually CORS, blocked requests, timeouts, or a dropped connection.
Check console logs for CORS errors. Check system info for VPN/network hints.
**`401` Unauthorized**
Token missing or expired. Session issues are common.
Ask the user to log out/in. Check auth refresh logic.
**`403` Forbidden**
Auth is present. Permission is not.
Check roles, entitlements, and feature flags.
**`404` Not Found**
Bad URL or missing resource.
Check routing, environment (staging vs prod), and ID validity.
**`5xx` Server error**
Usually an engineering escalation.
Include URL, payload, response body, and timestamp in the ticket.
### Privacy and security
{% hint style="danger" %}
Network logs can include sensitive data. Treat them like production logs.
{% endhint %}
Be careful with auth headers, cookies, and PII in payloads/responses.
Recommended practices:
* Restrict access to technical roles.
* Redact tokens before sharing externally.
* Avoid screenshots of raw headers/payloads.
### Limitations
* Large request bodies may be truncated.
* File uploads can show as `[Binary Data]`.
* Some third-party requests may omit bodies due to browser restrictions.
* Static assets can appear, but the full body might not be stored.
### Related pages
* [Console logs and Network](https://docs.screendesk.io/~/revisions/pAg2d5GCwbZlpJ20UTRh/request-screen-recording/developer-tools/console-logs)
* [System Info](https://docs.screendesk.io/~/revisions/pAg2d5GCwbZlpJ20UTRh/request-screen-recording/developer-tools/system-info)
---
# Agent Instructions
This documentation is published with GitBook. GitBook is the documentation platform designed so that both humans and AI agents can read, navigate, and reason over technical content effectively. Learn more at gitbook.com.
## Querying This Documentation
If you need additional information that is not directly available in this page, you can query the documentation dynamically by asking a question.
Perform an HTTP GET request on the current page URL with the `ask` query parameter, and the optional `goal` query parameter:
```
GET https://docs.screendesk.io/request-screen-recording/developer-tools/network-logs.md?ask=&goal=
```
`ask` is the immediate question: it should be specific, self-contained, and written in natural language.
`goal` is optional and describes the broader end goal you are ultimately trying to accomplish on behalf of the user. GitBook uses it to tailor the answer towards what is most useful for that goal.
The response will contain a direct answer to the question and relevant excerpts and sources from the documentation.
Use this mechanism when the answer is not explicitly present in the current page, you need clarification or additional context, or you want to retrieve related documentation sections.